
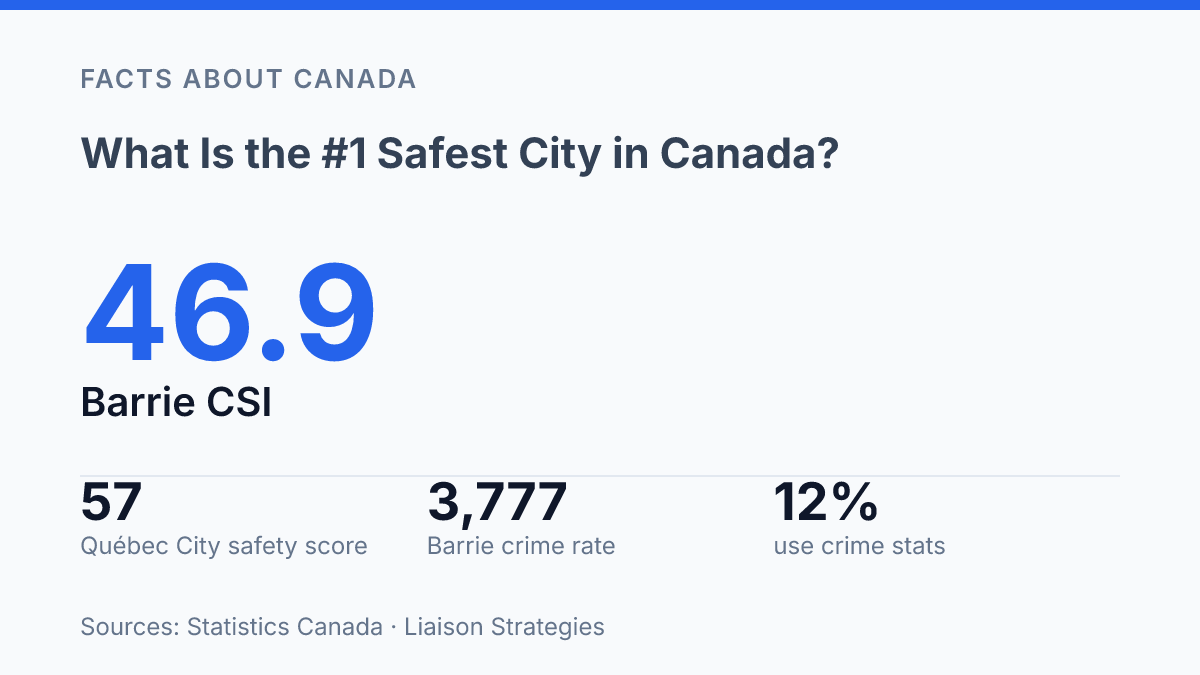
The answer to “What is the #1 safest city in Canada?” changes when crime severity, crime frequency, and public perception are measured separately. Statistics Canada’s 2025 CMA table gives Barrie the clearest claim on the latest official Crime Severity Index, with a CSI of 46.9 compared with Canada’s 75.0. Québec City, however, complicates the ranking: it had a lower police-reported crime rate than Barrie in the same dataset, led a 2019–2023 CSI average used by CIC News, and recorded the strongest net perceived safety score, +57, in Liaison Strategies’ 2026 national study.
That split is not a technical footnote; it changes the answer. This article explains why Barrie and Québec City both appear at the top, how the main data sources differ, and what those rankings actually mean for residents and people comparing places to live.
How Barrie and Québec City compare in safety rankings
Barrie records the lower latest police-reported Crime Severity Index, while Québec City wins the clearest recent perception-based safety ranking. On official crime-severity data, Barrie, Ontario is often the strongest candidate: Statistics Canada’s 2025 census metropolitan area table reported a CSI of 46.9 for Barrie, below the national CSI of 75.0, according to Statistics Canada. Because the CSI weights offences by seriousness rather than simply counting incidents, a lower score indicates not only fewer reported crimes in relative terms but also a lighter overall severity profile.
Which data sources are used to rank city safety?
The safest-city answer can change simply because one ranking weights serious offences more heavily while another asks residents how safe streets feel after dark. The main official source is Statistics Canada, whose Crime Severity Index is built from police-reported incidents rather than resident impressions. Its methodology assigns greater weight to offences associated with more serious court outcomes, so a smaller number of severe crimes can affect the index more than a larger number of less serious incidents.
That distinction matters because reported crime, crime severity, and perceived safety measure different things. A basic police-reported crime rate counts the volume of recorded incidents relative to population, while the CSI adjusts for seriousness and includes Criminal Code incidents, traffic violations, and other federal statute violations.
Statistics Canada sets the CSI against a 2006 base of 100, whereas the basic crime rate excludes traffic violations and is usually expressed per 100,000 people. These technical choices can change how one city compares with another without either dataset being incorrect.
Longer-window analyses may also produce a different leader than a single-year table. A 2024 CIC News analysis of Statistics Canada CSI data averaging 2019–2023 ranked Québec City first with an overall CSI of 45.73, narrowly ahead of Barrie at 47.71. Averaging several years can reduce the influence of short-term movement, but it may also lag behind the newest official figures.
Perception-based sources, such as the Numbeo Safety Index or resident polling, answer a separate question: how safe people feel. These surveys can reflect visible disorder, lighting, downtown activity, transit experiences, media coverage, or high-profile incidents that may not dominate police statistics.
For that reason, survey results should not be treated as equivalent to police-reported crime data. They are useful as a complementary lens, especially when a city performs well statistically but residents still identify specific places or times as less safe.
Why these cities tend to score well
A city can appear safer partly because of what happens there and partly because of how its urban area is built, counted, and policed. Barrie’s repeat strength in police-reported rankings is consistent with lower overall crime severity, but its local context matters: it is a smaller census metropolitan area north of the Greater Toronto Area rather than a large, high-density core city. CMA-level figures combine incidents across the wider urban area, so the result reflects not only central-city activity but also surrounding communities with different land use, commuting patterns, and policing arrangements.
Local perception data in Barrie shows why a strong overall ranking should not be read as uniform safety across every setting. In the Barrie Police Service’s 2024 Community Safety Survey, 87.62% of respondents said local schools felt safe in daylight, while 93.54% rated downtown Barrie unsafe at night; 2,459 people answered the primary safety-concerns question. That contrast suggests that low crime severity at the city or metro level can coexist with sharply different views by place and time of day.
Québec City’s standing is supported by both regional structure and recent police reporting. The city anchors the Capitale-Nationale region, but it is not as large or dense as Canada’s biggest metropolitan centres, and that scale can affect both crime patterns and public exposure to disorder.
In the Service de police de la Ville de Québec 2024 annual report, property offences declined from 13,259 in 2023 to 12,797 in 2024, while motor-vehicle thefts fell from 781 to 627. The same report said the police service covered 594,556 people, giving useful context for comparing a relatively large regional centre with much larger metro areas such as Toronto, Montréal, or Vancouver.
The common thread is not that these cities have no crime, but that their reported severity, urban scale, and regional policing context tend to support favourable safety scores. Rankings are therefore best understood as a combination of measured offences, offence seriousness, population geography, and local conditions rather than a single verdict on everyday life.
What the answer means for residents and movers
The practical difference between a low-crime city and a safe address often appears below the citywide ranking, at the neighbourhood and street level. A safest-city label should be treated as a starting point and checked against neighbourhood-level crime data, local police maps, community safety reports, and recent incident patterns rather than citywide rankings alone. Broad scores are useful for comparing places at a high level, but they are not precise enough to describe every block, school catchment, apartment district, or commercial area.
Local averages can hide meaningful variation between neighbourhoods in Barrie and Québec City. A citywide figure blends quieter residential areas with downtown streets, nightlife zones, retail corridors, waterfront areas, and places with heavier visitor traffic. That does not mean a highly ranked city is unsafe; it means the ranking describes the overall pattern, while daily exposure depends on where people live, commute, park, study, and spend time after dark.
Safety also intersects with practical access. Transit coverage, walkability, and housing costs can influence which city or neighbourhood is the better fit even when safety scores are strong. A lower-cost home farther from frequent transit may change travel routines, late-night mobility, or reliance on parking, while a more walkable area may reduce some risks and introduce others tied to busier public spaces.
For residents and movers, the most defensible takeaway is that Barrie and Québec City both have strong safety claims, but the relevant question is not only which city ranks first. It is whether the specific neighbourhood under consideration matches the household’s safety expectations in ordinary daily use.
What the safest-city label can and cannot settle
A safest-city ranking is most useful when treated as a starting point rather than a final verdict. The strongest statistical candidate can differ from the city people feel safest in, partly because most impressions are shaped by daily experience rather than formal crime tables; Liaison Strategies found that only 12% of respondents named crime statistics as the main influence on perceived safety.
For residents and movers, the practical consequence is clear: the better question is not only which city ranks first, but which measure matches the risk being assessed. A daytime school commute, a downtown walk after midnight, and property-crime exposure can point to different answers inside the same city.
Frequently Asked Questions
Q: Which city is considered the safest in Canada right now?
A: Barrie, Ontario and Québec City, Québec are the two places that most often appear at the top, depending on the measure used. Official police crime data and public perception surveys do not always produce the same result, so the answer varies by methodology.
Q: Why do some sources list Barrie as the safest city in Canada?
A: Barrie often ranks highly in official police crime statistics, which measure reported offences rather than perceptions. That makes it a strong candidate when the ranking is based on recorded crime rates.
Q: Why do other rankings choose Québec City instead?
A: Québec City frequently performs well in public perception surveys, where residents and respondents assess how safe a place feels. Those surveys capture confidence and experience, which can differ from police-recorded crime data.
Q: Do official crime stats and safety surveys usually agree?
A: Not always. Police data and survey data measure different things, so one city can lead in reported crime rates while another leads in perceived safety. That difference explains why Barrie and Québec City can both be cited as the #1 safest city in Canada.
Q: What should be checked before trusting a safest-city ranking?
A: The ranking method should be identified first, because the result depends on whether the source uses police-reported crime, survey responses, or another metric. A credible comparison should also specify the year and the data set used, since rankings can change over time.